

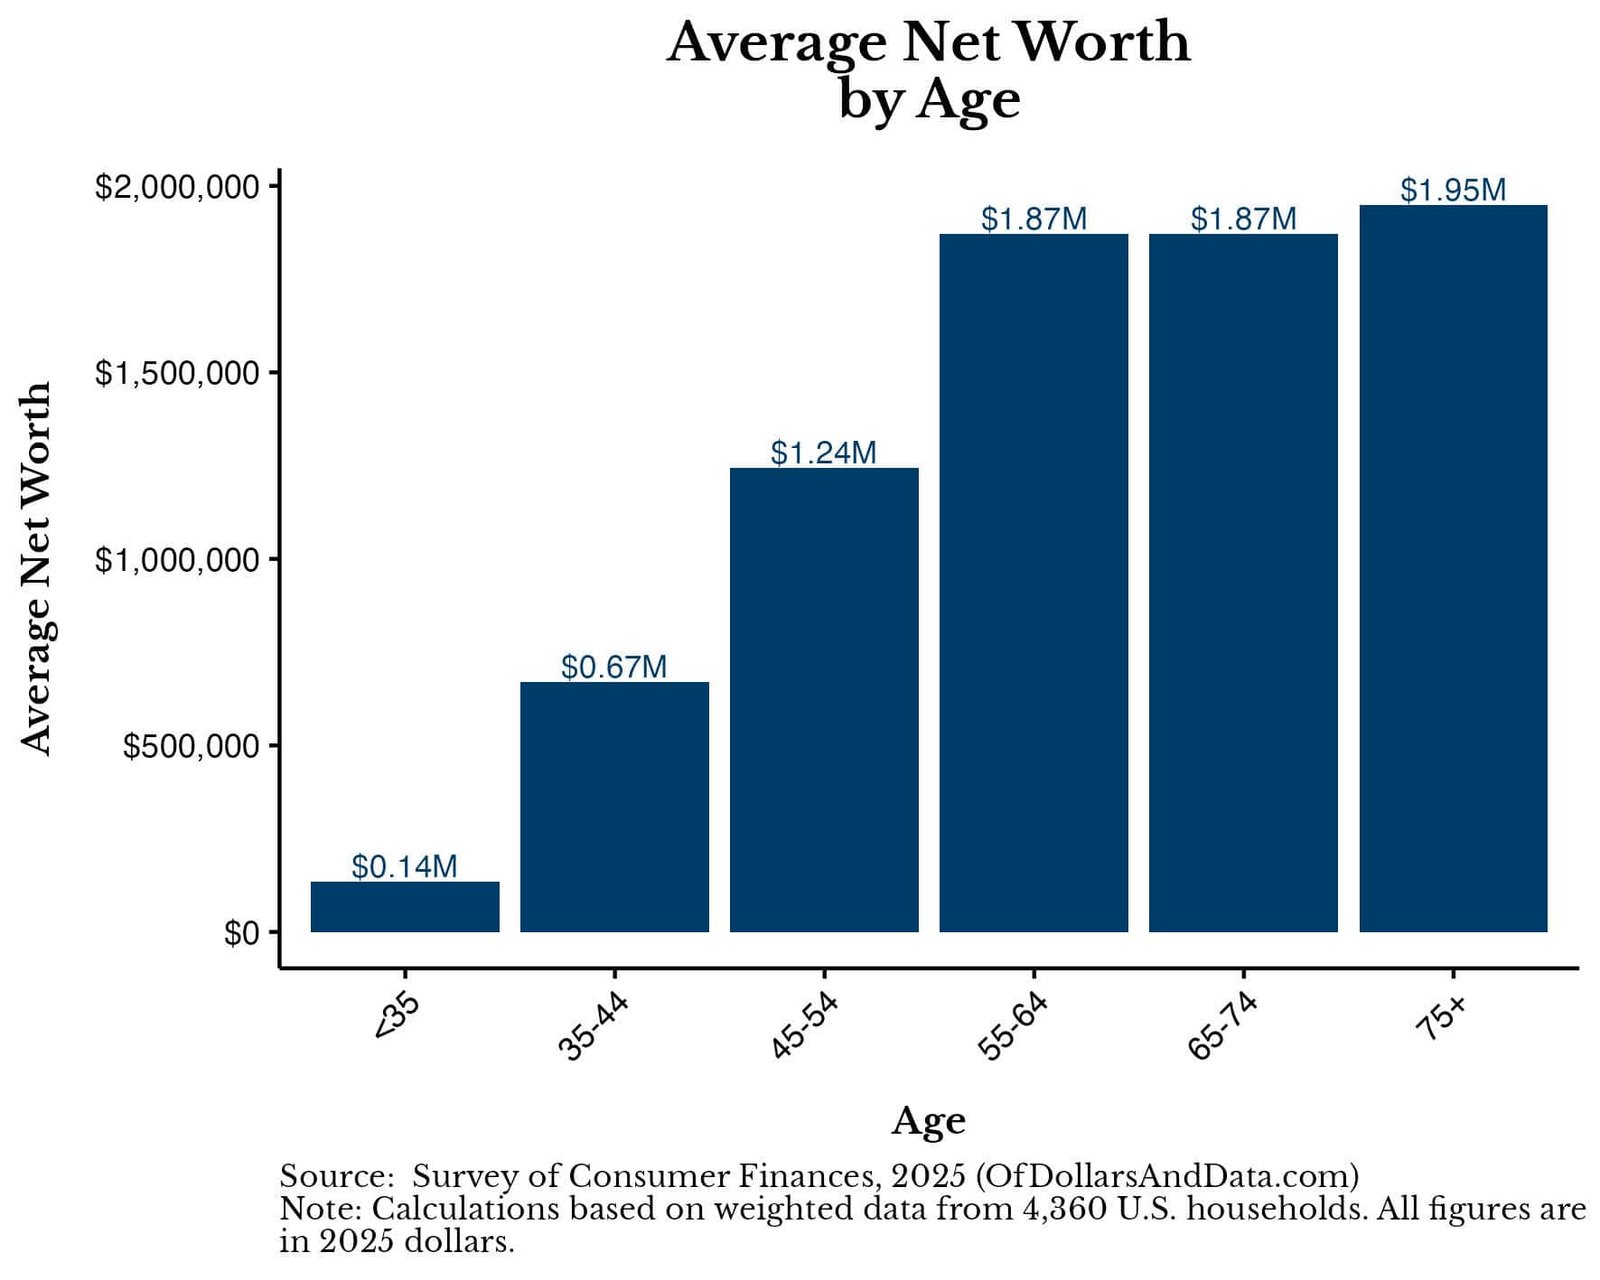
Do you want to know how you are doing relative to your peers financially? Then this is the article for you.
The Federal Reserve recently released its 2025 Survey of Consumer Finances, the gold standard of wealth data for American households. I’ve decided to take this data and calculate the average net worth by age so you can get a better handle on how you stack up financially.
Of course, we know that “comparison is the thief of joy,” but this doesn’t mean that benchmarking can’t be useful. This is especially true when it comes to benchmarking your wealth, something that is still taboo to discuss openly.
And since it isn’t discussed, most people can only infer how they are doing by looking at what people buy as a signal to their wealth. Unfortunately, this isn’t the clearest picture of someone’s finances. This is why we must rely on aggregated financial data (i.e. net worth).
More importantly, we must break this net worth data down by age for it to be useful to us. Why? Because age is positively correlated with how long you’ve worked, which is positively correlated with your savings and wealth.
After all, would it be fair to compare the wealth of someone with three decades of work experience against someone who just graduated from college? Of course not! Though that older person probably has more money, the younger person has more time (which can be used to create money). This is why comparing net worth by age is essential if we want to have a better understanding of our financial well-being.
But, before we dig into the data on net worth, let’s do a quick refresher on what it shows and how to interpret it.
What is Net Worth?
Net worth is the total value of an individual’s assets minus their liabilities:
Net Worth = Assets – Liabilities
In other words, it’s everything you own (i.e. house, car, bank accounts, stocks, ETFs, rental properties, etc.) minus everything that you owe to others (i.e. credit card debt, student loan debt, mortgage, etc.).
After netting the differences, we get a financial measure that we can use to compare across households. One other thing to note is that all of the net worth figures used in this article are inflation-adjusted to 2025 dollars. This means that I am showing real dollar changes when showing any year before 2025.
With that being said, let’s look at the average net worth and why this measure has its limitations.
What is the Average Net Worth (and What Are its Limitations)?
The average net worth of U.S. households in 2025 was $1,231,997.
This is an inflation-adjusted increase of $72,550 (6%) from the average net worth of $1,159,447 in 2022. If these figures seem high to you, it’s because they are. The typical American household is not walking around with $1 million in wealth.
The problem with the average net worth is that it tends to be heavily skewed by outliers (i.e. the superrich). For example, if 9 people (with a net worth of $100,000) were at a bar and Warren Buffett walked in (whose net worth is >$100 billion), the average net worth in the bar would skyrocket to over $10 billion! Unfortunately, this average would tell you little about the distribution of wealth among the bar’s patrons.
To correct for this, we can use the median net worth, which is the point at which half of the households are above and half of the households are below a particular value.
So what is the median net worth of all U.S. households in 2025?
$216,100
This is less than 1/5 of the average net worth and an inflation-adjusted increase of about $5,200 (+2%) from 2022 when the median net worth was $210,887 (in 2025 dollars).
But, once again, these figures don’t adjust for age, arguably the most crucial variable we need to control for to do a fair comparison. So, let’s do that now.
What is the Average Net Worth by Age?
After controlling for age, you can see that the average household net worth varies from as little as $136k to as much as $1.95M depending on where you are in life:
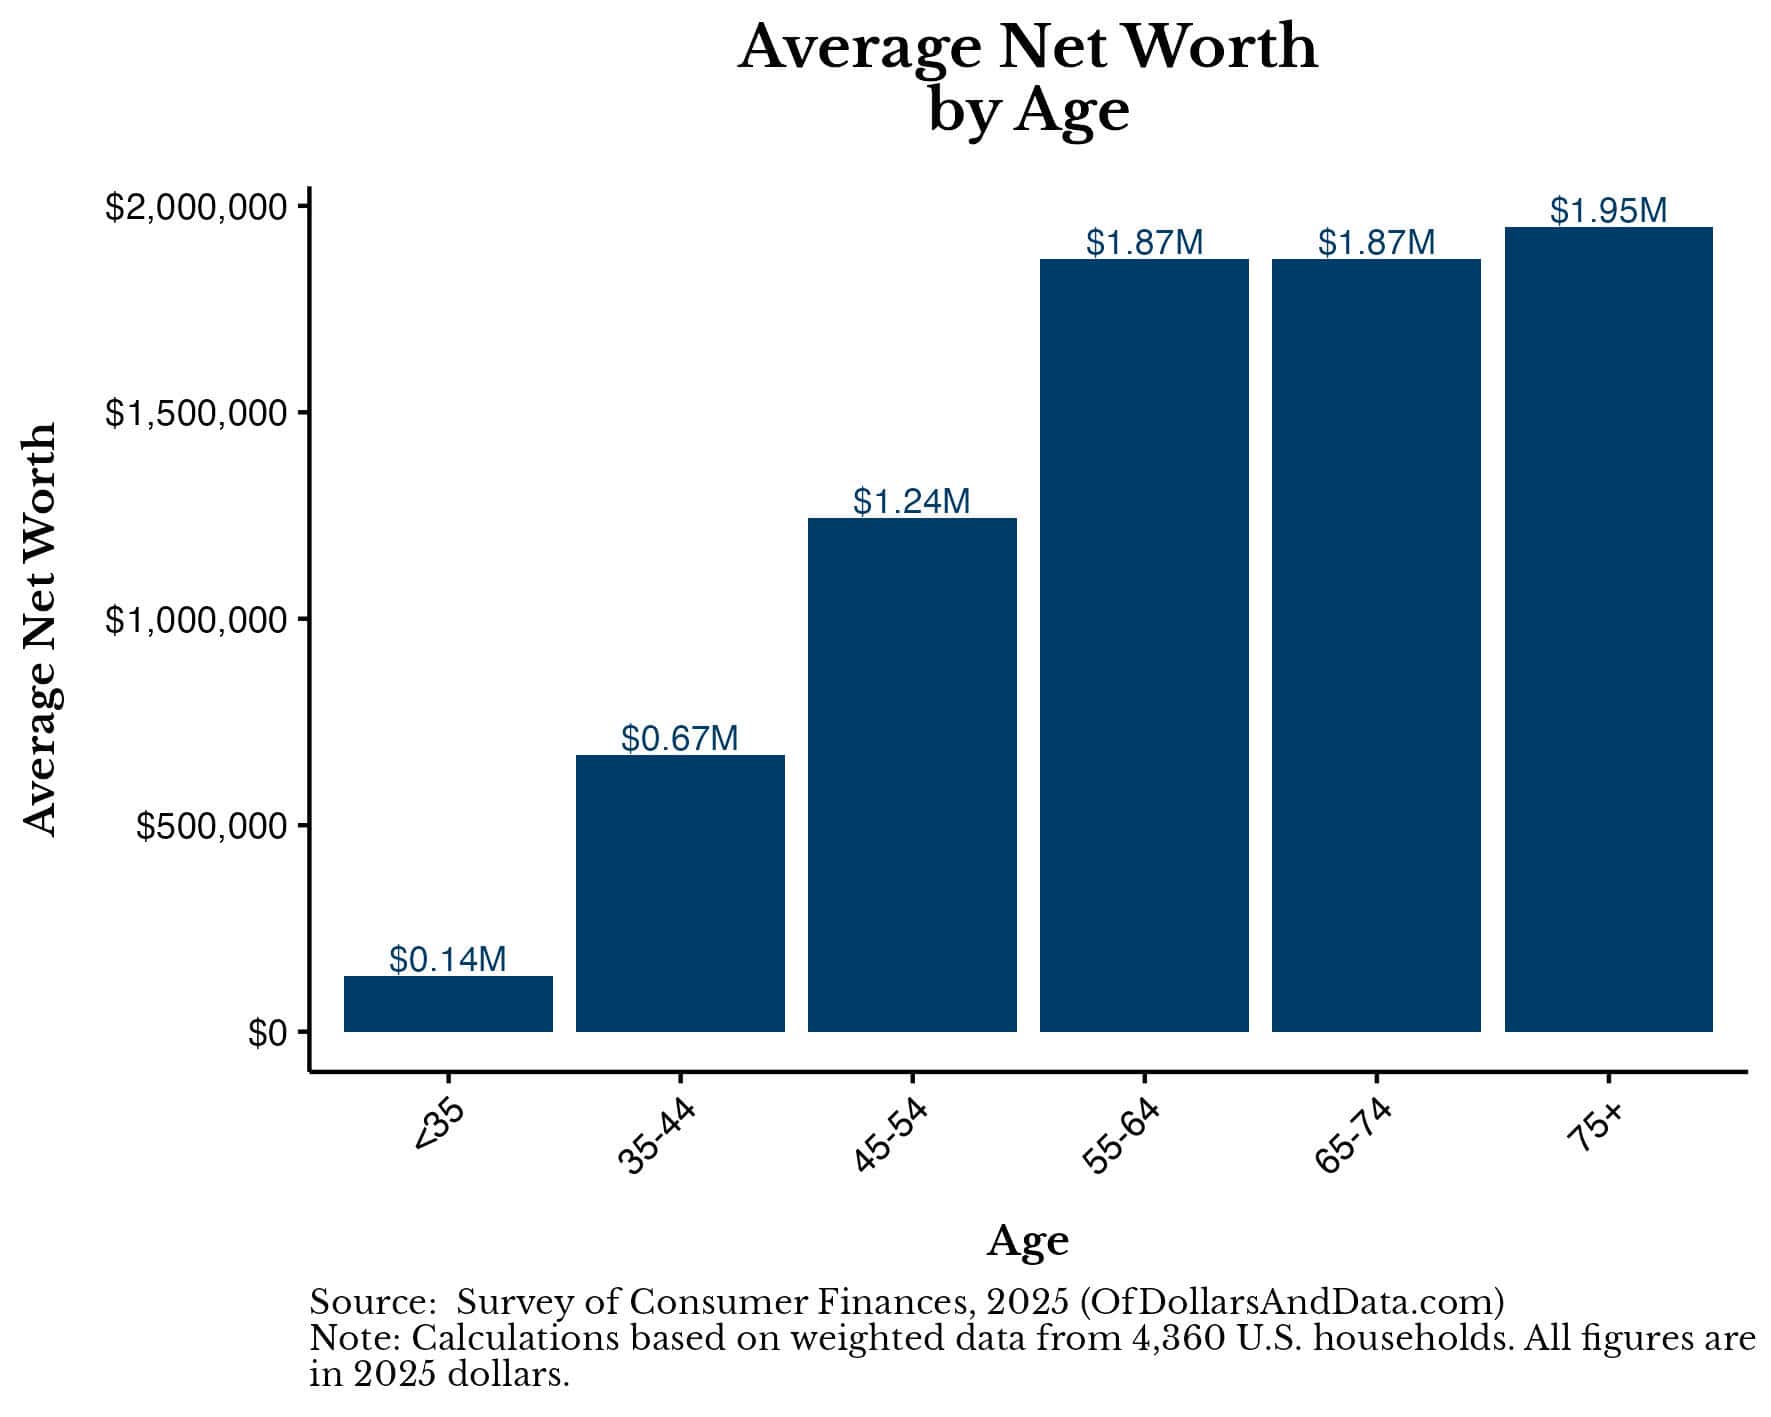
Once again, the average net worth by age tends to be skewed by the wealthiest households in each age bracket.
When we look at the median U.S. household’s net worth by age, the figures range from $33k-$505k, which are far more relatable to the typical American:

While we still see the pattern of rising net worth by age all the way to age 75+, these median figures are far lower than the averages.
If we break this data out into even smaller age ranges, we can better see how wealth tends to change across ages and where it peaks:
| Age Range | Average Net Worth | Median Net Worth |
|---|---|---|
| Under 25 | $43,566 | $13,050 |
| 25-29 | $104,441 | $35,790 |
| 30-34 | $201,398 | $64,300 |
| 35-39 | $588,215 | $127,170 |
| 40-44 | $757,910 | $181,030 |
| 45-49 | $995,373 | $217,000 |
| 50-54 | $1,499,654 | $290,000 |
| 55-59 | $1,608,679 | $252,020 |
| 60-64 | $2,097,867 | $528,960 |
| 65-69 | $1,818,435 | $436,800 |
| 70-74 | $1,930,205 | $424,400 |
| 75-79 | $1,827,606 | $415,600 |
| 80+ | $2,084,534 | $567,600 |
As you can see, household wealth tends to climb steadily until the early 60s (i.e. near retirement) and then plateaus. Note that some of the variation in this table (like the dip at 55-59 and the spike at 60-64) is likely noise, since each five-year age range only contains a few hundred surveyed households.
You also may have noticed that households 80 and older have the highest median net worth of any group. This can be partially explained by survivorship bias. Since wealthier people tend to live longer, as less wealthy households die off, the typical surviving household looks richer.
So while wealth doesn’t typically grow much after retirement, it doesn’t seem to decline much either. Technically, the SCF data can’t support this statement because it is a snapshot of different households at one point in time. In other words, today’s 65-69 year-old households may not look like today’s 70-74 year-old households five years into the future. Nevertheless, we know that most retirees don’t actually draw down their savings, so it is likely that this data is directionally correct.
If you want to dig deeper into household net worth by age, you can check out my net worth by age calculator, which is more precise than these age bands.
Now that we’ve looked at the average net worth by age (along with the median) let’s explore the data for those doing better or worse than the median.
What About Those Doing Better (or Worse) Than the Median?
The average/median can be a useful measure, but we don’t all take the same financial journey. Some of us work in fields that pay more. Some of us get inheritances. Some of us are luckier and some of us are less fortunate. You should keep these things in mind when viewing the financial situations of those at the upper (and lower) end.
To start, let’s look at the 25th percentile of net worth by age:

As you can see, even the households at the 25th percentile have positive net worths across every age range.
On the flip side, the 75th percentile households by net worth broken out by age are doing a bit better than the median (and are closer to the average):

Lastly, consider households in the top 10% of net worth for those who wish to strive for more:

Putting this all together, I’ve created a single chart that shows the 25th, 50th (median), 75th, and 90th percentile household net worths by age. [Note that this chart uses the same y-axis across each sub-chart to illustrate the absolute differences between the various distributions of net worth by age]:

This chart makes it much easier to see just how much wealthier the 90th percentile households are than their less fortunate counterparts. If you want the specific numbers behind these charts, you can find them in the table below:
| Age Range | 25th Percentile | Median | 75th Percentile | 90th Percentile |
|---|---|---|---|---|
| <35 | $3,100 | $32,820 | $145,090 | $351,200 |
| 35-44 | $18,000 | $156,000 | $467,520 | $1,233,620 |
| 45-54 | $54,730 | $254,670 | $941,970 | $2,557,390 |
| 55-64 | $71,790 | $411,340 | $1,416,200 | $3,457,640 |
| 65-74 | $118,105 | $431,900 | $1,312,100 | $3,656,000 |
| 75+ | $144,060 | $504,600 | $1,417,000 | $4,188,260 |
Where Do You Rank Within Your Age Group?
In the prior section we compared the same percentile of net worth across ages. But what if you want to see where you fall within your own age group? That’s what this section is for.
The chart below shows the full distribution of net worth (10th through 90th percentile) for the four age groups under 65. I excluded households 65 and older to keep the chart readable, but you can find their data here. [Note that the y-axis varies across each subplot to better illustrate each individual distribution]:

As you can see, across every age group wealth rises sharply near the top. For example, the 80th percentile among households 45-54 is about $1.1M, but the 90th percentile is more than double that at $2.6M. If you want to see exactly where you rank for your specific age (plus or minus two years), you can use my net worth by age calculator.
So far, everything we’ve looked at regarding net worth has included all assets that a household owns, including their home. However, the largest asset on a household’s balance sheet is typically their home. This raises a question I get asked more than any other about this data.
What If We Exclude Home Equity?
The most common question I get asked after sharing any net worth data is: “What if you removed home equity?” For the record, home equity is defined as the value of your primary residence minus any debts on the property (other real estate would still be included).
Well, without home equity the picture looks quite different.
While the median net worth overall is $216,100, when we exclude home equity it drops to just $69,200.
We can break this down even further if we examine the median net worth by age, both with and without home equity:

Note that the light and dark bars rank households separately. The household at the 50th percentile of total net worth isn’t necessarily the household at the 50th percentile once home equity is removed. For example, a 40-year-old renter with $150,000 in savings would be near the median on total net worth, but at the 68th percentile if home equity were excluded.
You can’t read the gap between the bars as “how much home equity the typical household has.” Instead, just evaluate each benchmark separately. If you want to compare your total net worth, use the light bars. If you want to compare your net worth excluding home equity, use the dark ones.
For completeness, I’ve also included the 25th, 75th, and 90th net worth percentiles by age with and without home equity in the plot below (where the same caveat applies). [Note that the y-axis varies across each subplot and you will need to zoom in to read the figures]:

Given that these charts rank net worth and net worth (without home equity) separately, we can’t tell how much of a household’s wealth is tied up in their home.
To fix that, I ranked households by total net worth and then calculated the share of each household’s net worth held in home equity. I then plotted the median share for two different groups: the 40th-60th percentile and the top 20% by age:

As you can see, for the typical household 35 and older, home equity makes up between 55% and 70% of their net worth. For households in the top 20% of their age group, the home equity share is lower at around 15% to 25%. Note that the typical household under 35 has no home equity share (0%) because most young households don’t own homes.
The conclusion from this data is crystal clear—the less wealthy you are, the more of your wealth is likely in your home. This is probably why people ask me to remove home equity for these statistics. Because removing home equity for the typical household removes most of their wealth.
Does this mean that you should remove home equity when evaluating your wealth? Not necessarily. Despite what some may say, home equity is real wealth. You can liquidate it, borrow against it, and pass it on to the next generation while also reducing your ongoing housing expenses (i.e., no rent). Though home equity is not as liquid as a brokerage account and you can’t spend it (without taking out debt), it’s still wealth. Of course, I wouldn’t consider it as a part of my “spendable” wealth, but to ignore it altogether would be a mistake as well.
The Bottom Line
Understanding the average net worth by age is more than just a financial exercise—it’s a way to gauge your financial health in the context of your peer group. While the average net worth figures shown above can be skewed by outliers, looking at the distribution of outcomes—and particularly the median—can offer a more relatable snapshot.
But regardless of whether you are at the 25th percentile or the 90th percentile of the wealth spectrum, it’s crucial to remember that these are just benchmarks. Your financial journey is yours and yours alone. It will be influenced by a variety of factors such as career choice, inheritance, and luck. You can’t lose sight of this when digesting the financial figures above.
And no matter what your net worth is, you have to keep moving towards your financial goals. Because they are the only ones that will matter in the end anyway.
Happy investing and thank you for reading!
If you liked this post, consider signing up for my newsletter.
This is post 525. Any code I have related to this post can be found here with the same numbering: https://github.com/nmaggiulli/of-dollars-and-data
