

Last Friday, the Federal Reserve released the results of its 2025 Survey of Consumer Finances (SCF), which takes a detailed snapshot of American households’ finances every three years.
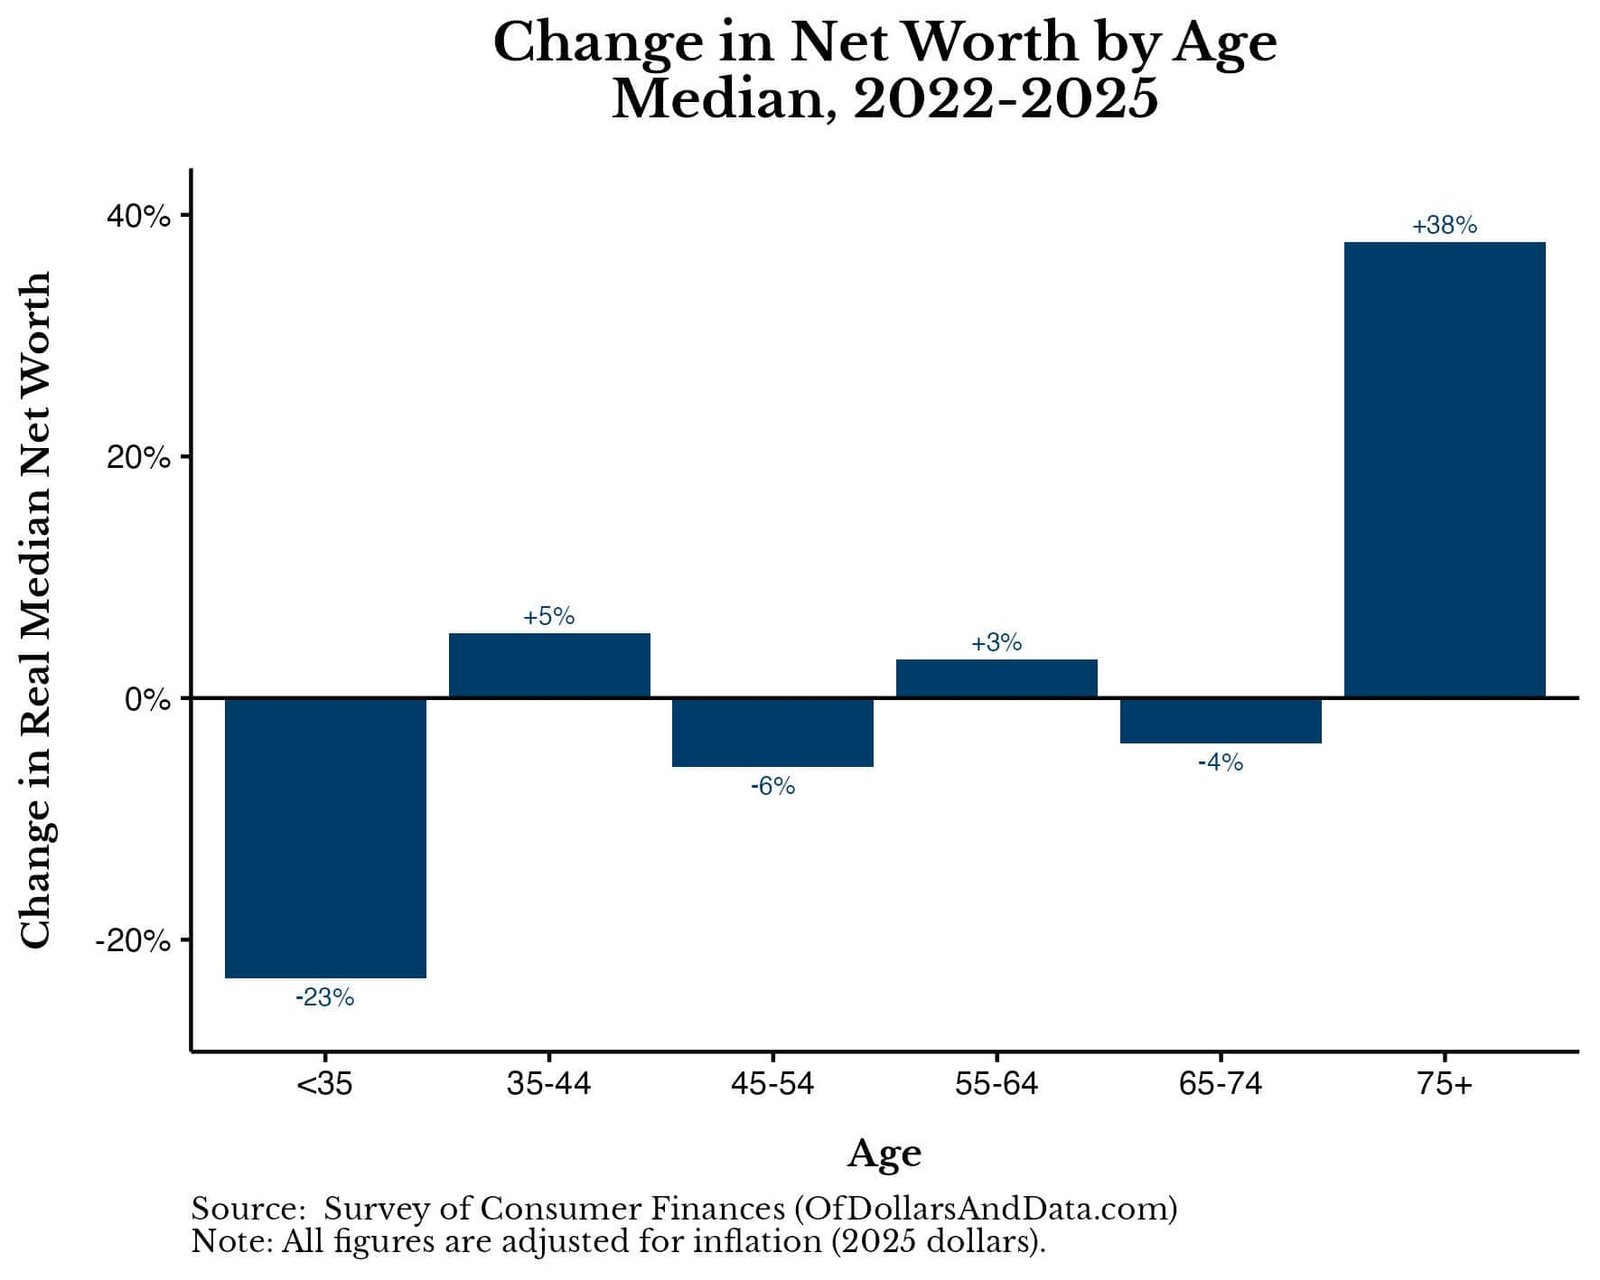
And the big takeaway from this year’s release is clear—older Americans got richer while younger Americans got poorer. From 2022-2025, the median net worth of households 75 and older went up 38%, while the median net worth of households under 35 fell by 23% (adjusted for inflation):

Households in between saw far smaller changes, with no other age cohort seeing more than a 6% shift in median net worth in either direction. [Author’s Note: the SCF surveys only a few thousand households, so changes within smaller groups (like a single age bracket) can be noisy. Therefore, you should focus on the direction of these trends (which are more reliable) over the exact percentages.]
To put these numbers in perspective, below is a table showing the actual net worth changes across age cohorts (in 2025 dollars):
| Age | 2022 | 2025 | $ Change | % Change |
|---|---|---|---|---|
| <35 | $42,725 | $32,820 | -$9,905 | -23% |
| 35-44 | $148,069 | $156,000 | $7,931 | +5% |
| 45-54 | $269,983 | $254,670 | -$15,313 | -6% |
| 55-64 | $398,649 | $411,340 | $12,691 | +3% |
| 65-74 | $448,695 | $431,900 | -$16,795 | -4% |
| 75+ | $366,288 | $504,600 | $138,312 | +38% |
The Wall Street Journal was the first to report on this, but the headline numbers don’t tell you how this happened. What caused the wealth of older Americans to surge as younger Americans fell behind?
That’s what this post is about. So let’s take a look at who got richer since 2022 and why.
Are the Rich Getting Richer?
When the mainstream financial media reports that older Americans are getting richer while younger Americans are falling behind, it’s tempting to simply say that “the rich are getting richer.” While this isn’t wrong, it’s not quite right either.
For example, if we were to look at the percentage change in real net worth from 2022 to 2025, we would see that the richest households saw net worth gains while the poorest households saw net worth losses:

Since those at the 20th percentile experienced a net worth decrease of 11% while those at the 70th percentile (and above) experienced a net worth increase of ~11% (or higher), it seems like the rich got richer while the poor got poorer.
This is the classic “K-shaped economy” story, where the top moves up and the bottom moves down. But once you examine this by age, the relationship breaks down.
The plot below illustrates the change in real net worth from 2022 to 2025 only for households under 35:

As you can see, households under 35 had less wealth in 2025 than in 2022 across most of the wealth spectrum (except the 80th percentile, which may be a sampling issue). While these households are not the same set of households over time, young households today have less wealth than young households did just three years ago.
The flip side is also true. If we were to plot the percentage change in real net worth from 2022 to 2025 only for households 75 and older, we would see that net worth increased across most of the wealth distribution (i.e. everywhere but the bottom 10%):

Part of this gain comes from wealthier baby boomers aging into the 75 and older group. If we follow the same birth cohort over time (those 72 and older in 2022, who were 75 and older by 2025), their median net worth rose from $418,720 to $504,600, a 21% increase. That’s smaller than the 38% headline, but still a sizable gain.
If wealth alone were driving this change, then we would expect households with similar net worths to experience similar wealth gains, regardless of age. But this isn’t what happened.
For example, the 90th percentile net worth among households under 35 was $351,000 in 2025, similar to the 40th percentile net worth among households 75 and older. Despite this, the net worth of 90th percentile households under 35 declined by 14% from 2022 to 2025 while the net worth of 40th percentile households 75 and older increased by 38% (again, partly from wealthier boomers aging in). More importantly, less wealthy older households at the 20th and 30th percentiles gained 26% and 45%, respectively.
In other words, the wealthiest young households are poorer and the less wealthy older households are richer in 2025 (relative to 2022). This means that something other than total wealth is driving these changes. Let’s see what it is.
What Drove the Change in Net Worth?
When we look at what drove the change in net worth for households under 35 and those 75 and older, the answer is a combination of housing, financial assets, and cars. The chart below shows the average change in wealth for the middle 50% of households in each age group across various assets and liabilities between 2022 and 2025:

As you can see, older households saw gains in their primary residence, retirement accounts, and other assets. Meanwhile, younger households saw a decrease in housing wealth, a decrease in vehicle wealth, and a decrease in retirement accounts. Let’s start by looking at housing.
The chart below illustrates how those under 35 are far less likely to own a home than those 75 and older. And this has been true for the past six years:

While stock ownership, retirement account participation, and vehicle ownership are similar across these two age cohorts, homeownership isn’t. The share of households under 35 that own a home actually declined from 38.5% in 2022 to 35.6% in 2025. This means that younger households aren’t participating in the housing market as much as they used to.
And since the median young homeowner has roughly 15 times the net worth of the median young renter ($184,000 vs. $12,000), even a small drop in homeownership pulls down the wealth of the typical young household.
This isn’t because young renters got poorer either. In fact, the median net worth of young renters reached $12,000 in 2025, the highest level in the SCF data going back to 1989:

The problem is that fewer young households became homeowners. And with around 64% of households under 35 not owning a home, most young households are on the wrong side of this divide.
Additionally, younger households hold a much smaller share of their overall assets in financial assets. In 2022, stocks, funds, and retirement accounts made up about 9% of total assets for the middle 50% of households under 35, compared with 16% of total assets for the middle 50% of households 75 and older. So when U.S. stocks rose roughly 48% (after inflation) from 2022 to 2025, older households had much more of their overall assets benefiting from the rally.
Lastly, younger households hold far more of their assets in cars. In 2022, vehicles made up about 20% of total assets for the middle 50% of households under 35, compared with under 6% for the middle 50% of households 75 and older. That matters because used car prices, which spiked during the pandemic, have since come back down. The median value of young households’ vehicles fell 21% from 2022 to 2025, while it was essentially flat (−1%) for older households.
While a different mix of assets seemed to drive the wealth divide over the last three years, there’s more going on beneath the surface. If we go back another three years to 2019, the recent decline among younger households looks very different.
A Step Back (Not a Collapse) for Young Households
To understand what happened to younger households over the last three years, we need to look at what happened to them over the three years before that. As the chart below shows, the median net worth of households under 35 went from about $18,000 in 2019 to nearly $43,000 in 2022 (a 140% increase), before declining to $33,000 in 2025. Meanwhile, households 75 and older saw a modest 13% increase in their net worth from 2019-2022, before the 38% increase from 2022-2025:

What caused the big jump in median net worth from 2019-2022 among younger households? The exact cause isn’t known, but stimulus checks, paused student loan payments, and rising asset prices likely contributed to the gains. Either way, the increase in wealth among younger households during the pandemic was the largest on record.
Therefore, the recent step back, while not a great sign, may represent a return to normalcy among younger households. After all, student loan payments have resumed and there are no more stimulus checks (for now).
But normalcy doesn’t mean that everything is okay. That’s why what we do about the finances of young American households is so important.
What Can We Do About It?
When it comes to who got richer since 2022, the answer is simple—those who owned assets, especially ones that didn’t depreciate. Younger households were far less likely to own homes, they held less of their assets in financial assets (which rose in value), and they held more of their assets in their vehicle (which declined in value).
While it’s tempting to point out that younger households are wealthier today (in inflation-adjusted terms) than they were before the pandemic, this argument feels incomplete now. In 2021, I argued that millennials weren’t poorer than previous generations, and the data eventually proved me right.
But things feel different with the youngest households, many of whom are Gen Z. The job market for recent college graduates is the worst on record (as AI continues to improve) and housing is the most unaffordable it’s been in 40 years. This means that two of the primary pillars of wealth-building (higher income and homeownership) are increasingly out of reach for the youngest households.
I mention this because older households that built wealth over the last few years didn’t necessarily have to do anything differently. Their wealth gains came from appreciating assets. There’s nothing wrong with that. But many younger households may not get the opportunity to build wealth in this way.
Which is why I want to make a plea to anyone in a position to help: give now, not later.
Most wealth will eventually get passed down anyway, but the problem is timing. Unfortunately, most people who receive an inheritance get it in their 50s and 60s. At that age, the money matters far less than it would have at 30. This is why giving earlier can be the more impactful move.
Giving doesn’t mean having to write a big check either. It could mean:
- Contributing to a down payment for your child/grandchild.
- Letting adult children live at home to save money on rent.
- Using the annual gift tax exclusion to give smaller amounts annually ($19k per recipient, or $38k if married) instead of a large lump sum later.
- Offering advice, connections, or mentorship to help your child/grandchild in the job market.
Of course, if you aren’t in a place to give financially, don’t. But if you have more than you’ll ever need, helping younger family members today could be the best investment you ever make.
I know I don’t have many readers over age 75, but if you know someone who might value this idea, pass it along. Because the answer to “who got richer since 2022?” is clear. What they do with it next is what really matters.
Thank you for reading.
If you liked this post, consider signing up for my newsletter.
This is post 524. Any code I have related to this post can be found here with the same numbering: https://github.com/nmaggiulli/of-dollars-and-data
